
Executive Summary
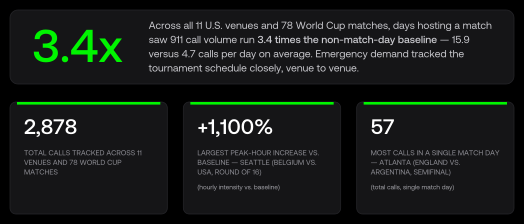
Call volume near World Cup venues followed the events and matches calendar closely. Across the 39-day window (June 11–July 19), the 11 tracked venues averaged 15.9 calls on match days versus 4.7 on non-match days. The effect was directionally consistent across venues, though absolute volumes were modest and varied widely with market size and each location’s local 911 baseline.
Some of the highest call volumes occurred during knockout-round matches. Group-stage matches in Seattle, Atlanta, and Philadelphia also ranked among the busiest days. Seattle’s Round of 16 (Belgium vs. USA) produced the largest peak-hour increase over baseline at +1,100%, while Atlanta’s semifinal (England vs. Argentina) recorded the highest single match-day call count at 57.
Key Findings
For public safety and enterprise security teams: scheduled events are a predictable driver of 911 volume. Match-day increases followed the tournament calendar closely, so they can be anticipated and planned for in advance.
Match days lifted every venue - volume tracked market, not the matchup
Venues ranked by average 911 calls per match day (green). The light marker shows each venue’s non-match-day baseline; the multiplier compares the two. Every venue rose on match days, but absolute volume tracked market size and local baseline more than the matchup itself.
The multiplier measures relative lift from each venue’s own baseline. By actual call volume, the highest totals were in larger markets such as Seattle and Atlanta.
The biggest match days weren't the biggest matches
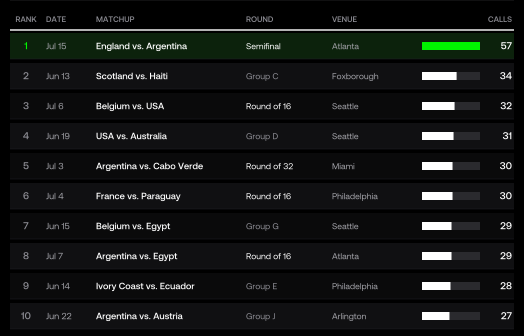
Ten highest single-match-day 911 call totals across all 11 venues, ranked by calls. Hourly “peak vs. typical” percentages are omitted here — they track a different measure (intensity vs. each venue’s local baseline) and don’t rank the same way as call volume.
The stage of the tournament was a weak predictor of call volume. Only one of the ten busiest match days was a semifinal, and the Final does not appear at all — the Spain–Argentina final drew roughly 10 calls near MetLife. Group-stage and Round-of-32 matches in large markets (Seattle, Atlanta, Philadelphia) frequently outdrew later-round games elsewhere. Volume tracked with crowd size and market. The stage of the competition was a secondary factor.
Atlanta's semifinal was the tournament's single busiest match day — by a wide margin
Each bar is one match day at Mercedes-Benz Stadium; the dashed line marks the venue’s non-match-day baseline (11.4 calls/day). The July 15 semifinal drew 57 calls — the single highest match-day total anywhere in the tournament, more than double the next-busiest match here. One group match (Spain vs. Saudi Arabia, Jun 21) fell below the venue’s normal daily volume.
Atlanta’s knockout matches produced higher call volumes than its group-stage days, with one exception. The England–Argentina semifinal produced the single busiest match day of the entire tournament.

The Final drew the world's eyes — but barely moved New York's 911 baseline
Deviation from a typical Sunday, by time of day. Through kickoff (15:00) and the match, both New York City and Manhattan held at or below their normal Sunday volume. Activity rose above baseline only in the evening, after the final whistle — and Manhattan (+42%) ran roughly double the citywide peak (+21%). The stadium itself, in New Jersey, saw about 10 calls all day.
The world’s most-watched match was, for 911, a non-event in New York. An estimated 80,000 fans at the stadium and tens of thousands more at watch parties — including roughly 50,000 on the Central Park Great Lawn — produced no abnormal emergency load. Volume was suppressed during the match itself and surfaced only as a modest, Manhattan-centered bump after the final whistle. A globally significant event, absorbed by New York without a spike in 911 demand.

Conclusion - RapidSOS Harmony AI and this World Cup analysis
A WORD OF THANKS TO PUBLIC SAFETY
This analysis reflects the work of public safety across the eleven U.S. cities that hosted the 2026 World Cup — and the communities around them. Over 39 days and 78 matches, as millions gathered at stadiums, fan festivals, and watch parties, 911 professionals stood ready around the clock. While the rest of us watched the matches, they kept our communities safe. At RapidSOS we have the rare privilege of seeing that work up close and at scale. Thank you to the dispatchers, call-takers, and first responders who helped make the tournament safe for everyone.
ABOUT THIS ANALYSIS
This analysis is provided “as is” and “as available,” without warranty of any kind, express or implied, including but not limited to warranties of accuracy, completeness, or fitness for a particular purpose. It is intended for informational and discussion purposes only and should not be relied upon as a basis for operational, budgetary, or policy decisions without independent verification. Figures reflect sampled 911 call activity within the H3 K1 ring around each venue over June 11–July 19, 2026 (local time), compared against Harmony’s proprietary time-of-day and day-of-week baselines. Absolute call volumes are small at the venue level; multipliers and percentages are approximations derived from this data set and may not reflect actual totals. “Peak vs. typical” measures hourly intensity against baseline and is not directly comparable to daily call-volume figures. Methodologies, baselines, and categorizations are proprietary to RapidSOS and subject to revision. For agency-specific information, contact your local public safety agency.
ABOUT RAPIDSOS
RapidSOS is the leading public safety AI company that unlocks mission-critical intelligence for first responders and enterprise security teams — enabling faster, smarter, and more accurate emergency response. RapidSOS Harmony AI is the first AI platform built by public safety specifically for mission-critical operations. Informed across 1 billion+ incidents, Harmony supports response operations across 23,500+ state and local agencies and 250+ large enterprises, helping to protect 700 million+ people in 16 countries.
INTELLECTUAL PROPERTY & USAGE RIGHTS
© 2026 RapidSOS, Inc. All rights reserved. RapidSOS, Harmony AI, and the RapidSOS logo are trademarks of RapidSOS, Inc. This report may be shared in its entirety with attribution to RapidSOS. No portion may be modified, excerpted for commercial purposes, or used to train machine learning models without the prior written consent of RapidSOS. All data, analysis, visualizations, and methodologies contained herein remain the intellectual property of RapidSOS, Inc.