For fans, the Super Bowl begins at kickoff.
For 911, it starts hours earlier—and lingers long after the final whistle.
While the Super Bowl is unique in scale, the pattern it creates is not. Concerts, championships, festivals, political events, and large public gatherings all produce similar demand curves—just at different magnitudes.
This analysis isn’t about one game. It’s an anatomy lesson: how major events reshape emergency demand, what those shifts look like in real time, and what cities can do to prepare before the first call arrives.
Large-scale events don’t just increase call volume. They reshape when, where, and how emergency demand shows up. And until recently, much of that shift was only understood in hindsight.
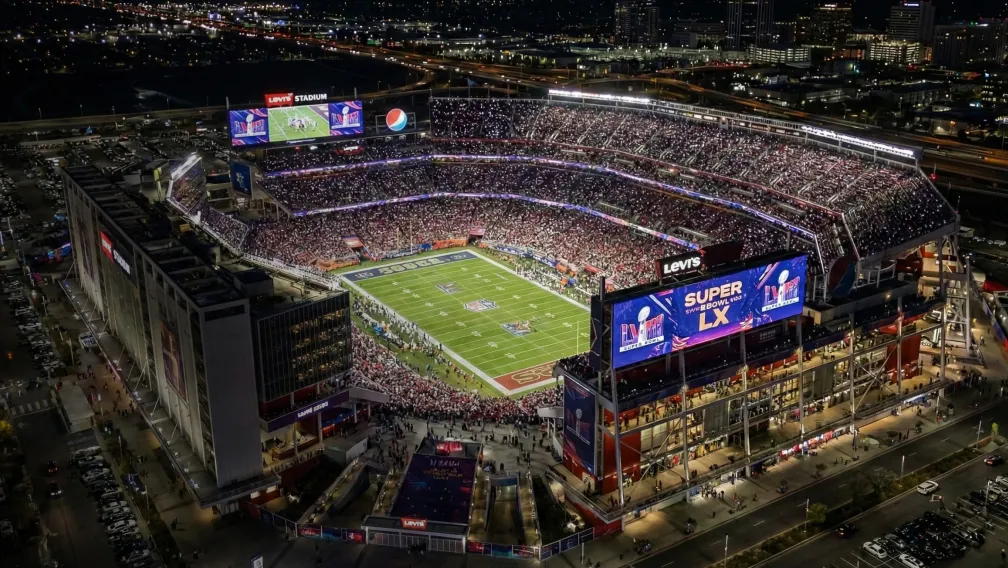
Super Bowl LX offered a clear opportunity to see that change as it happened.
RapidSOS supported agencies in real time during Super Bowl Sunday and later analyzed activity tied to Levi’s Stadium and the surrounding area, offering a behind-the-scenes view of how major events reshape emergency demand.
What emerged was a distinct, measurable safety footprint—one that unfolded in predictable phases, intensified near the venue, and highlighted why real-time context matters when pressure is at its peak.
Measuring the event footprint
To understand how the Super Bowl affected emergency demand, we analyzed activity from the City of Santa Clara ECC, using a geofence based on Levi’s Stadium’s footprint with additional 0.5-mile and 1-mile buffers.
To isolate the impact of the event itself, volumes were compared against a baseline: the prior Sunday (February 1) during the same time window.
The results showed a clear and sustained lift throughout the day.
ECC-wide volume
Pre-game (1:00–3:30 PM PST)
During game (3:30–7:36 PM PST)
Post-game (7:36–9:34 PM PST)
Even at the ECC-wide level, demand nearly doubled during the game window. But the most revealing insight appeared when zooming in geographically.
Where demand concentrates
Within one mile of Levi’s Stadium, the surge wasn’t just noticeable—it was extreme.
Pre-game
During game
Post-game
This wasn’t simply a busy day—it was a clear validation of how major events apply pressure unevenly. Demand didn’t rise uniformly across the region; it clustered tightly around the event footprint and shifted in character as the day progressed.
This event also showcased the reality that many ECCs experience daily: some calls originally meant for one jurisdiction are answered at a neighboring ECC, typically leading to manual handoff headaches and delays in dispatch. On the day of the Super Bowl, 3 ECCs in the Santa Clara area used Real-Time Interoperability to resolve these calls more easily. This meant:
- HARMONY AI transcribed and summarized calls in real-time
- That real-time intelligence was automatically shared between the answering agency and the authoritative agency
- And the agencies could use an interagency chat window to coordinate more easily.
For ECC leaders, this type of visibility reinforces planning decisions already being made—when to upstaff, where to expect pressure, and how demand will evolve from pre-event buildup to post-event dispersal. It also highlights where plans are most strained: during moments dominated by low-detail calls and rapid crowd movement, when real-time context and shared situational awareness matter more than raw volume alone.
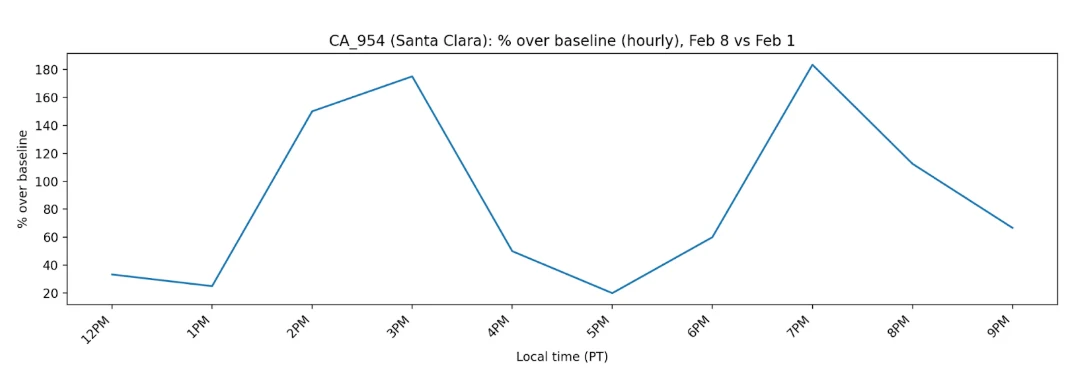
The shape of a Super Bowl day
When viewed hour by hour, the call curve followed a familiar—but important—pattern:
- A strong pre-kickoff ramp as crowds arrived and activity increased
- A steadier mid-game period
- A sharp post-game spike around 8:00 PM as tens of thousands of people moved at once
At its peak, hourly call volume reached roughly +180% above baseline.
This kind of temporal shape is typical of large crowd events—but seeing it emerge in real time allows agencies to respond to it, not just study it afterward.
These shifts matter because they’re predictable. And predictable demand is something agencies can plan for—if they can see it early.
What changes during a major event
Volume is only part of the story. Call characteristics shift as well.
Compared to baseline activity, the City of Santa Clara ECC saw a relative increase in:
- Calls with limited or evolving details (often reported by third parties or observers in moving crowds)
- Non-emergency calls
- Vehicle crashes and traffic-related incidents
Medical and law enforcement calls remained substantial in absolute volume, but the largest relative lift came from calls where clarity lagged behind reality—non-urgent reports, incomplete information, and traffic-related issues tied to crowd movement.
In large crowd environments, callers may be unsure of their location, uncertain about what they’re seeing, or reporting situations that are still unfolding. These calls demand more questioning and faster context-building, increasing cognitive load for telecommunicators even when the incident itself isn’t life-threatening—exactly where real-time summaries and added context provide the most operational support.
Why real-time intelligence matters
During an event like the Super Bowl, emergency demand doesn’t arrive neatly categorized. It arrives noisy, uneven, and time-sensitive. And it arrives at far greater scale than on a normal day.
Mission-critical intelligence – delivered in real-time and interoperable across agencies in a region – can help support the professionals who are managing this surge in demand. And the data from the Super Bowl offers lessons for leaders across Public Safety:
For ECC Directors
The pressure:
You already know the surge is coming. The hard part is keeping the floor steady when call quality drops, stress rises, and your most experienced people are carrying the heaviest cognitive load.
What helps:
Having key details surfaced early—without changing workflow—so call-takers and dispatchers spend less time digging for clarity and more time making decisions. Support matters when it reduces friction for your people, not when it adds another thing to manage.
For Regional 911 Leaders:
The pressure:
Major events don’t stay neatly inside jurisdictional lines. Demand spills, callers move, and coordination matters more than perfect boundaries.
What helps:
Real-time interoperability—where call data and context move with the incident—reduces the need to recreate information center by center. On days like this, shared, real-time visibility allows neighboring agencies to operate from the same picture, supporting coordinated response without slowing each other down.
For State 911 Leaders:
The pressure:
You’re thinking beyond one event or one center. You’re watching for strain points—where volume, staffing, or infrastructure could tip from manageable to brittle.
What helps:
Seeing how demand concentrates and shifts in real time reinforces where resilience actually lives: in systems that allow data to move across jurisdictions before any single center becomes overwhelmed.
For Law Enforcement Leaders:
The pressure:
Post-event movement is unpredictable. Calls come in fast, locations blur, and the risk window changes quickly once crowds disperse.
What helps:
Timely, hyper-local insight into where activity is clustering—so resources can be positioned based on what’s actually happening, not just what was planned. Accuracy matters more than volume when timing is tight.
This is what modern emergency response increasingly requires: not just knowing where a call is coming from, but understanding the evolving shape of demand across time and space.
The takeaway
The Super Bowl produced a measurable, real-time safety footprint with clear pre-game, in-game, and post-game dynamics. That footprint was highly concentrated around the stadium and driven by the kinds of calls that challenge traditional workflows during large-scale events.
For public safety, this isn’t just about one game. Major events reshape emergency demand in predictable ways—creating early ramps, venue-centered surges, and post-event spikes shaped by crowd dynamics and information-limited calls.
Seeing those patterns emerge in real time helps agencies move from reactive response to informed preparedness, changing how cities plan for what comes next.